If you found writing the story hard try:
This is quite easy to do and sometimes it shows very clearly what is happening.
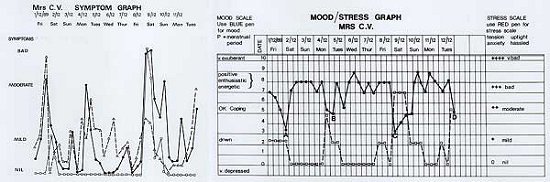
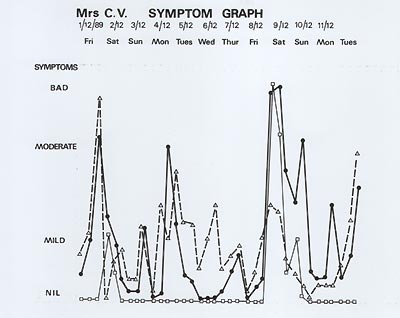
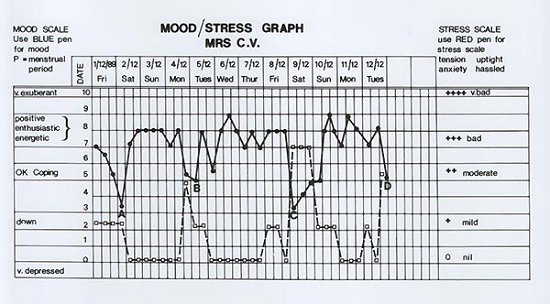
Have a look at this example. The patient Mrs C.V. has recorded, three times a day, the level of her abdominal symptoms, tiredness, and headaches, and also her mood and stress levels. If you look carefully you will see that all her symptoms tend to go up or down together, and that increases in symptoms coincide with a drop in mood and/or an increase in stress levels. Your graphs may or may not turn out as clear as this.
If you would like to do graphs for yourself then print off the SYMPTOM GRAPH and the MOOD/STRESS GRAPH.
Click here for printable version of the Symptom Graph
Click here for the printable version of the Mood Stress Graph
This is fairly easy.
Make a list of your main symptoms and choose a different colour pencil/pen for each. You will see that there is a box at the top for each day, and a line for recordings to be taken morning, noon, and night each day. You have to decide at these times how bad each symptom is and record it with the appropriate colour.
After several days, by joining your marks you will have a fluctuating line for each symptom.
This is a little more complex than the Symptom Graph.
At the left end is a Mood Scale, or, as we say it, the scale where we rate how up or down we are. Everybody is on this scale somewhere. Most people fluctuate up and down perhaps between “positive, enthusiastic, energetic” (where most of us would like to be all the time) and “down”. To help you the bottom of the scale would be ‘suicidal’ and the top of the scale ‘manic’. If you are near these levels we strongly recommend you seek medical help. Use a blue pen to rate your mood three times a day. It is really important to write down what level you are at rather than what you would like to be at!
At the right end is the Stress Scale. Here we mean tension, anxiety, hassled, uptight—words that express the opposite of relaxed. You have to decide whether you are mildly, moderately, badly, or very badly tense or anxious. Using a red pen you mark your level three times a day in the same line where you put a blue mark for Mood.
Don’t be confused by the Anxiety Scale being at the right end, we have done that to keep it separate from the Mood Scale. Both graphs are written and read from left to right.
After some days of filling in your graphs look carefully at each graph and compare fluctuations in your symptoms and mood/stress levels for each day-make sure you get the dates right!
You may start to see a pattern.
1. The straight line along positive, enthusiastic, energetic. These people are either extremely fortunate, or out of contact with their feelings, or in denial. Most people know they fluctuate. People with straight lines are at risk of physical symptoms in our view, because they tend to put their unacknowledged emotional variations and issues into bodily form.
2. The straight line along “OK/Coping”. This group tend to experience life in a rather flattish, grey way, with not much to be excited or complain about (except physical symptoms). They may be more down than they think, but manage to keep away from being really down.
3. Some appear to sit between 6-8 but have downers and symptoms emerge each time they go down.
4. Some drift up and down over longer periods and their symptoms drift to match.
Some people can see no correlation between Mood/Stress and Symptoms and yet when the meaning of their symptoms is explored they improve greatly. These graphs are not useful in everybody. They just are not precise enough for many situations.
Even if you cannot see any correlation, have you become more aware of what is happening to you?—if so, this can be the main benefit of the exercise.
Most often we see that when Mood graph line goes down the Stress graph line goes up.
Don’t get hung-up on this exercise—move on.